Maths – Data Unit
One of the Maths topics we have been learning about in the 5/6 Level has been about Data. We learned about how you can use a tally chart to help keep an accurate summary and how we can present this information in a variety of different graphs. Some of the different graphs we have learnt about so far include a bar graph, column graph, line graph and stem and leaf plot.
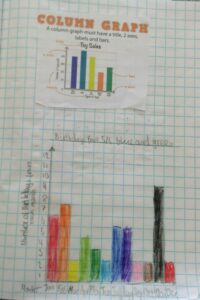
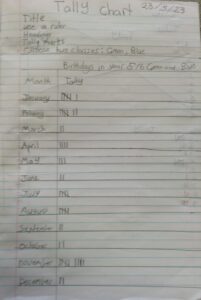
One of our data surveys was based around collecting data about birthdays where we got to survey other students in the 5/6 level. We all tallied the data then presented this information into one of the graphs we learnt about. We finally posted these surveys on Seesaw for our families to see.
Overall, everyone enjoyed participating in our Data unit and learning about some of the different types of graphs
Here are a couple of photos of our work from our Data unit.

